Statistics infrastructure at Python Discord
We have several tools setup to assist with the collection of statistics within Python Discord. We use these statistics to audit several things within the guild, such as help channel capacity, errors within our services and redundant channels.

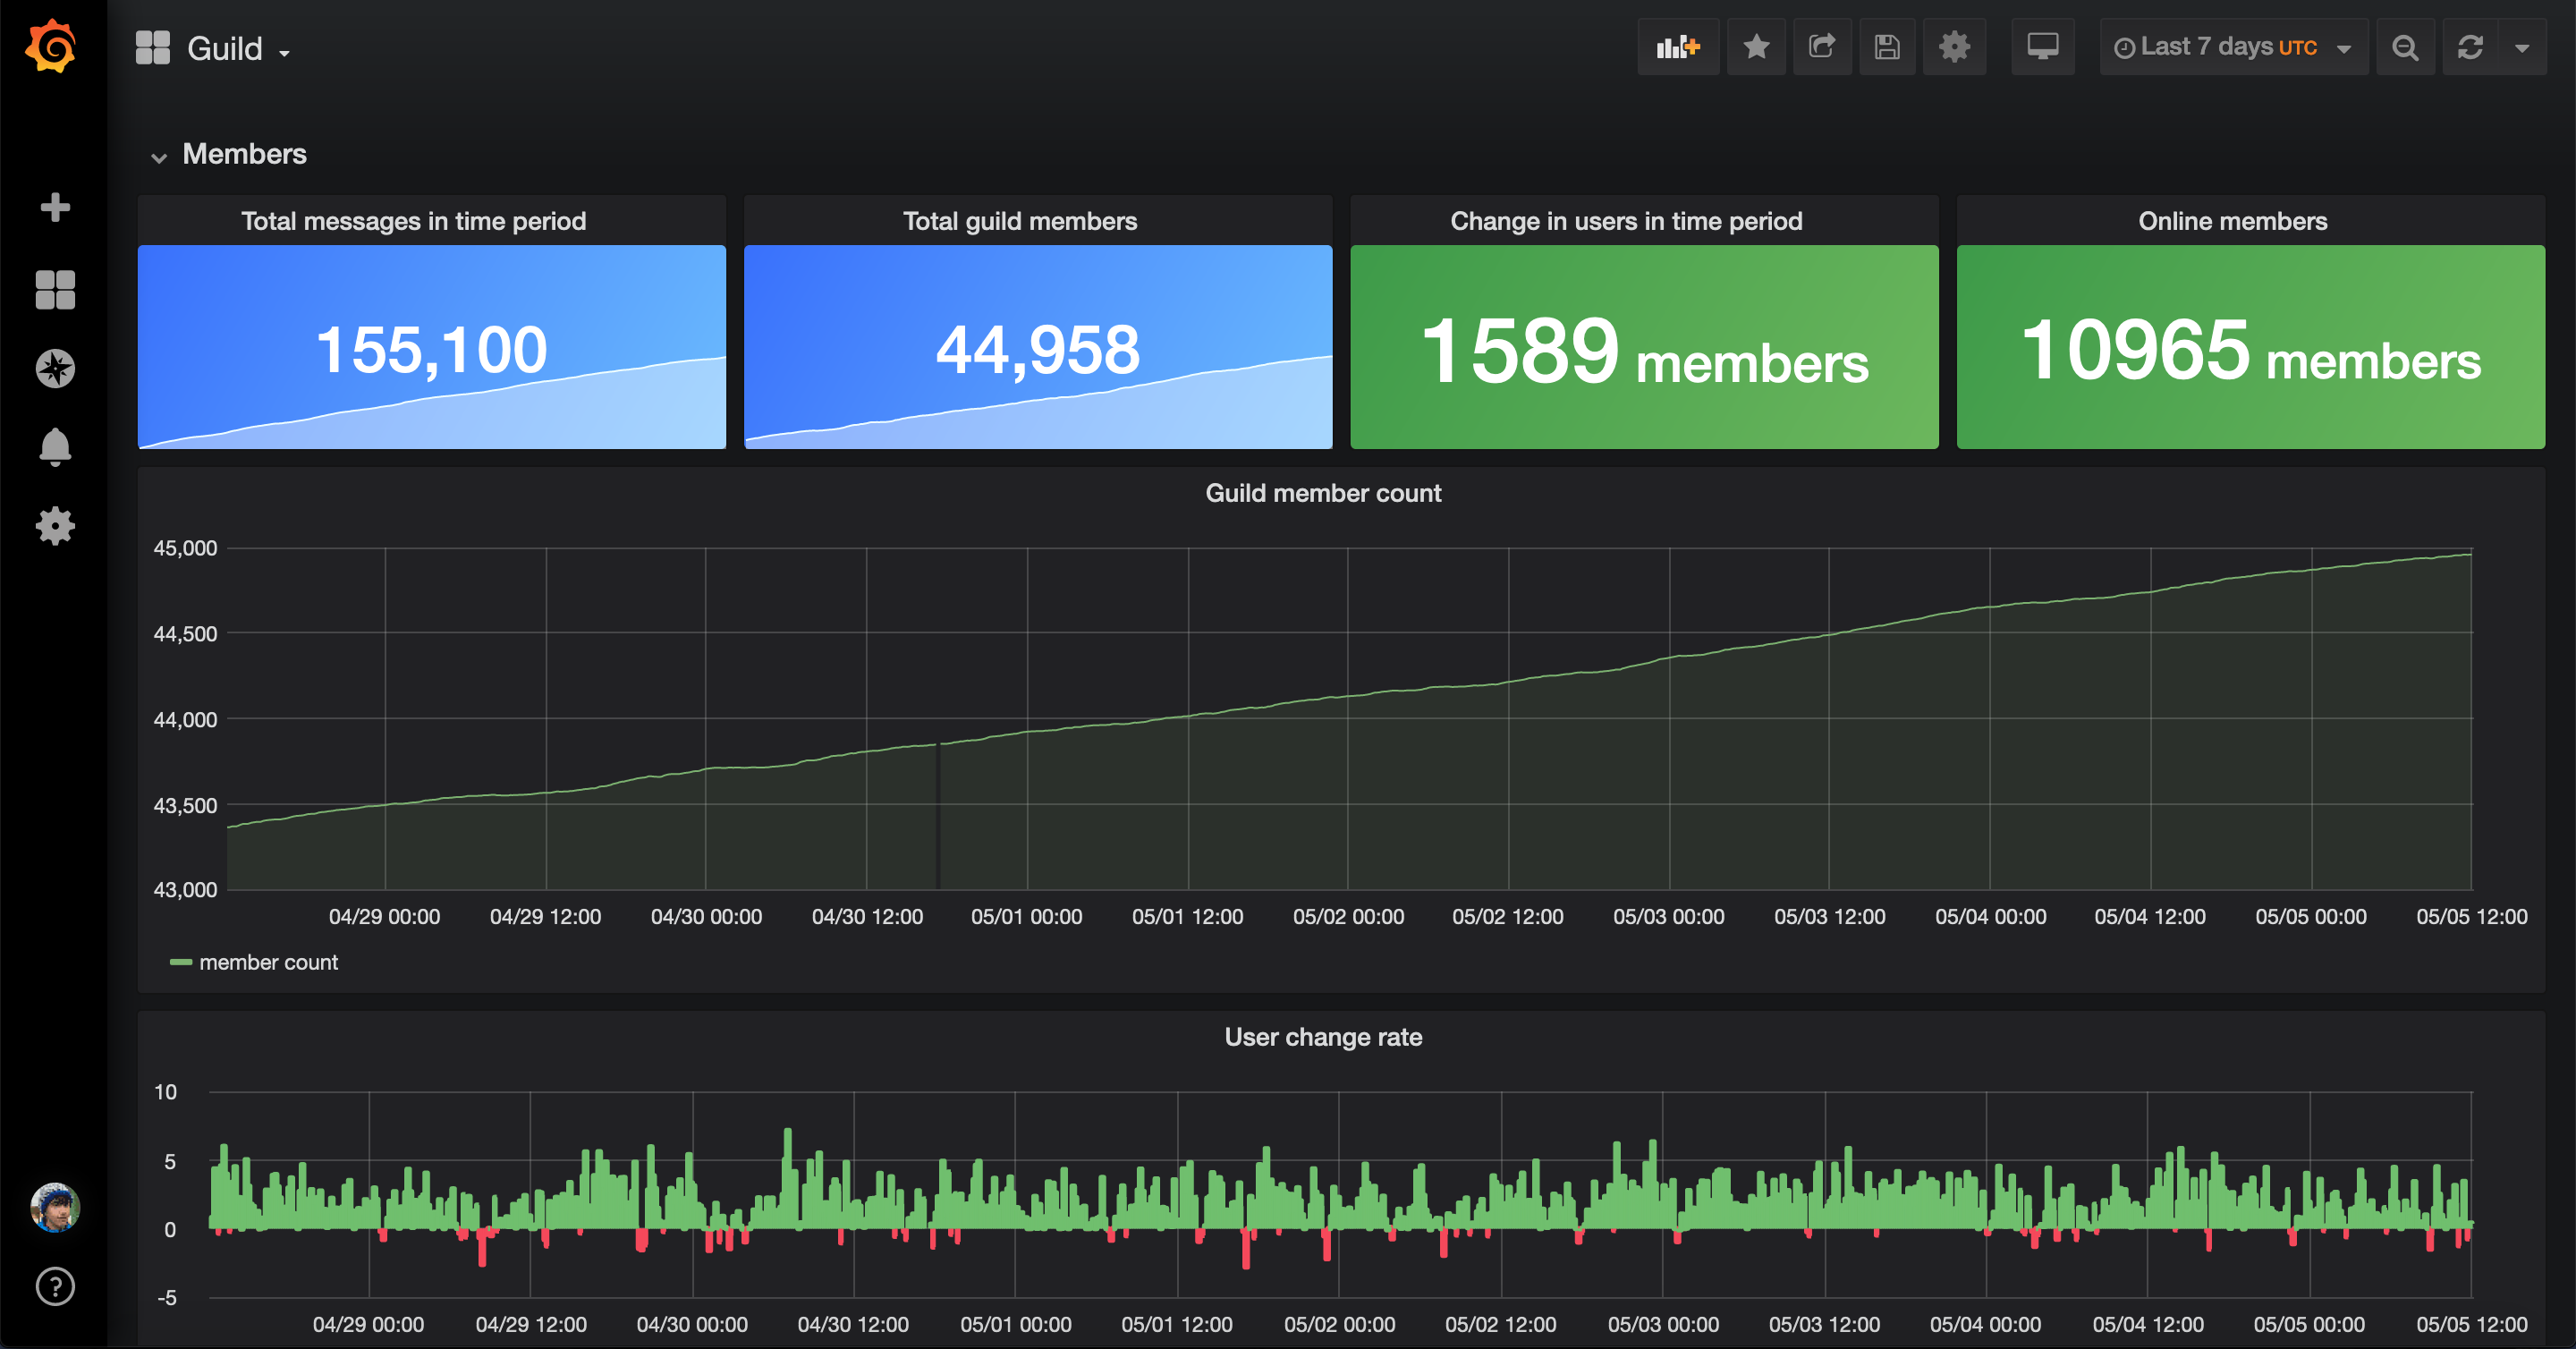
We have several tools setup to assist with the collection of statistics within Python Discord. We use these statistics to audit several things within the guild, such as help channel capacity, errors within our services and redundant channels.
This article talks about several of the tools we use and problems we overcame while building this system.
Grafana


Grafana is the main visualisation tool we use, it queries several data stores including PostgreSQL, Prometheus and Graphite to render sweet looking graphs to our team.
Graphite


Graphite is our statistics ingress, it receives statistics from projects over the network and writes them to the disk. It also provides a HTTP API that Grafana queries to render metrics.
statsd
statsd
statsd is a simple daemon for statistics accumulation providing a pleasant UDP API for writing statistics. It's good for fire-and-forget metrics with minimal overhead.
In statsd, a metric packet looks like this:
foo:1|cThis packet tells statsd (which eventually forwards to Graphite) to accumulate the counter (indicated by the c) named foo by 1.
StatsD is just the method of accumulation before it forwards on to Graphite which handles all storage and allows Grafana to query the statistics. We found a docker image by the Graphite team called graphite-statsd which allowed us to spin up an instance of Graphite and statsd together allowing for writing & querying to the same service, dramatically simplifying setup.
Python Client
Our main use for Graphite is accumulation of statistics from our Discord bot. To do this we use the statsd library for Python.
jsocol
This is where we hit our first problem with the statistics infrastructure. While our bot is written using asyncio, this client is not. To solve this we had to write an asyncio UDP transport to deliver metrics to statsd without risking our client blocking up the whole bot.
This was a fairly easy solve though, all it required was a ~40 line implementation of a async transport subclassing some base classes from the statsd library. That code can be found here.
Since we run services in Kubernetes hooking up a client from any app is very easy, all they have to do is connect to the service running on graphite.default.svc.cluster.local:8125 and start sending stats over UDP, they'll immediately be queryable from Grafana.
From a Python perspective, sending a new metric is as simple as:
self.bot.stats.incr("my_counter")For Python Discord, the push architecture of Graphite suited us better than the pull architecture of Prometheus since we did not want to have to open ports on our bot container and write pull configurations every time we hooked up new services.
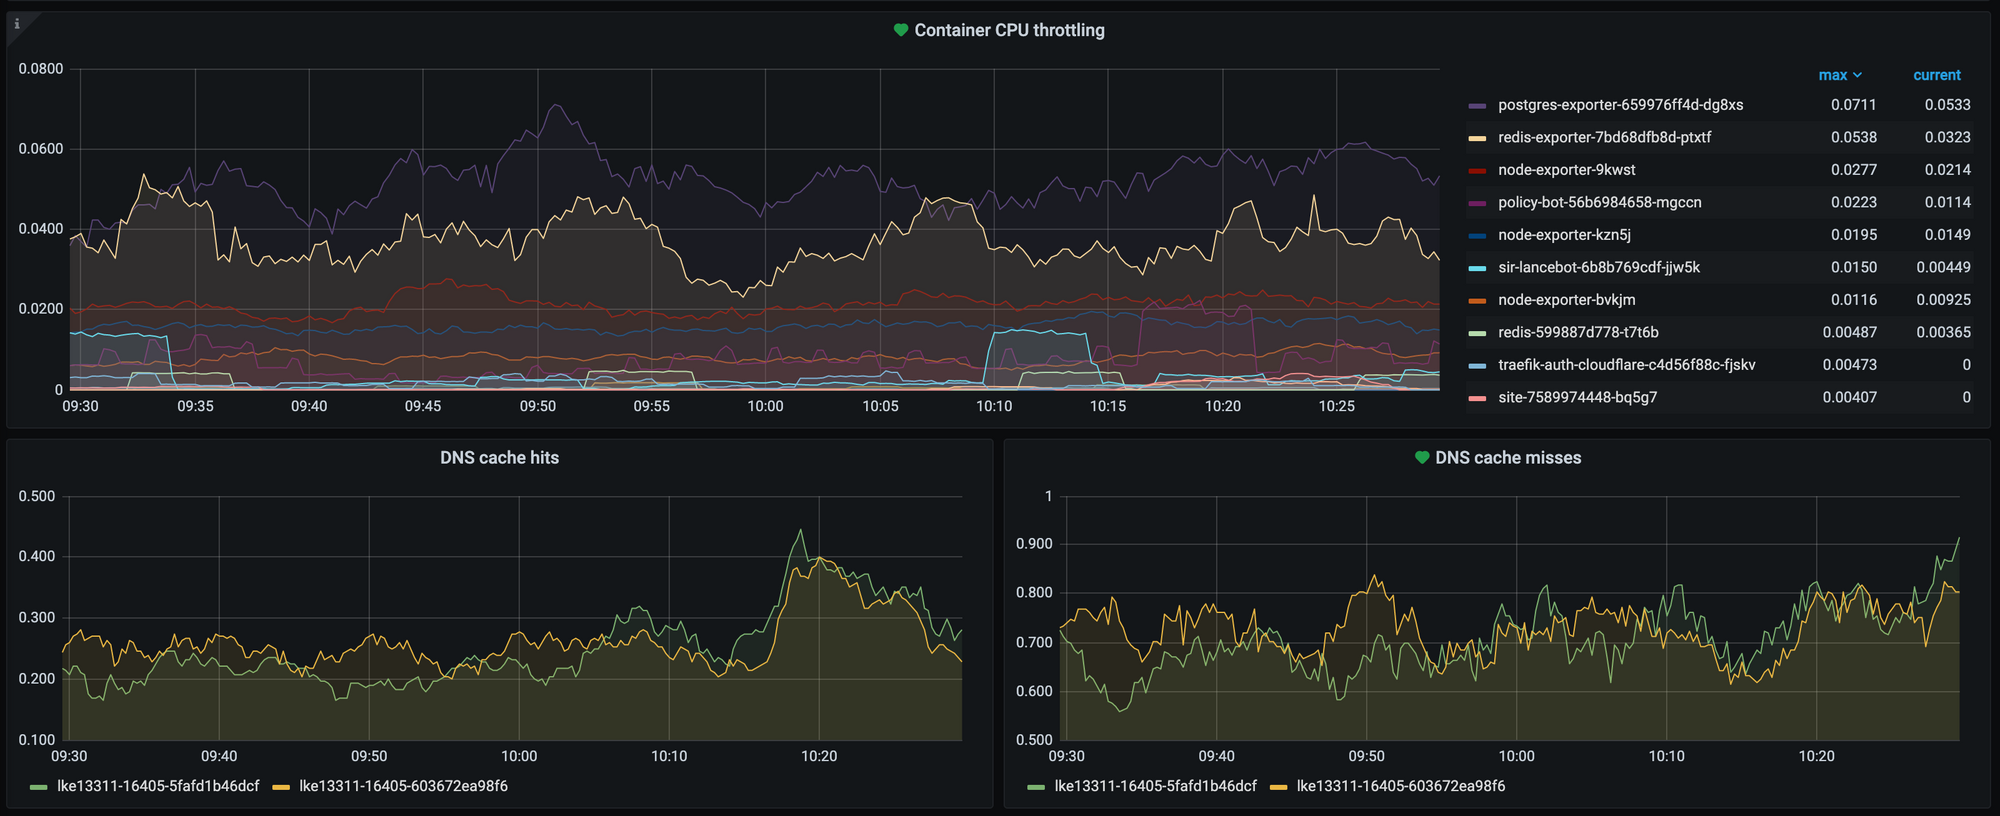
Prometheus
 Prometheus
While the pull nature of Prometheus did not suit us for Python Discord services such as the Discord bot or the site, it did suit the monitoring of our critical services.
We use several exporters for Prometheus to collect stats on different services:
google prometheus-community
 oliver006
 prometheus
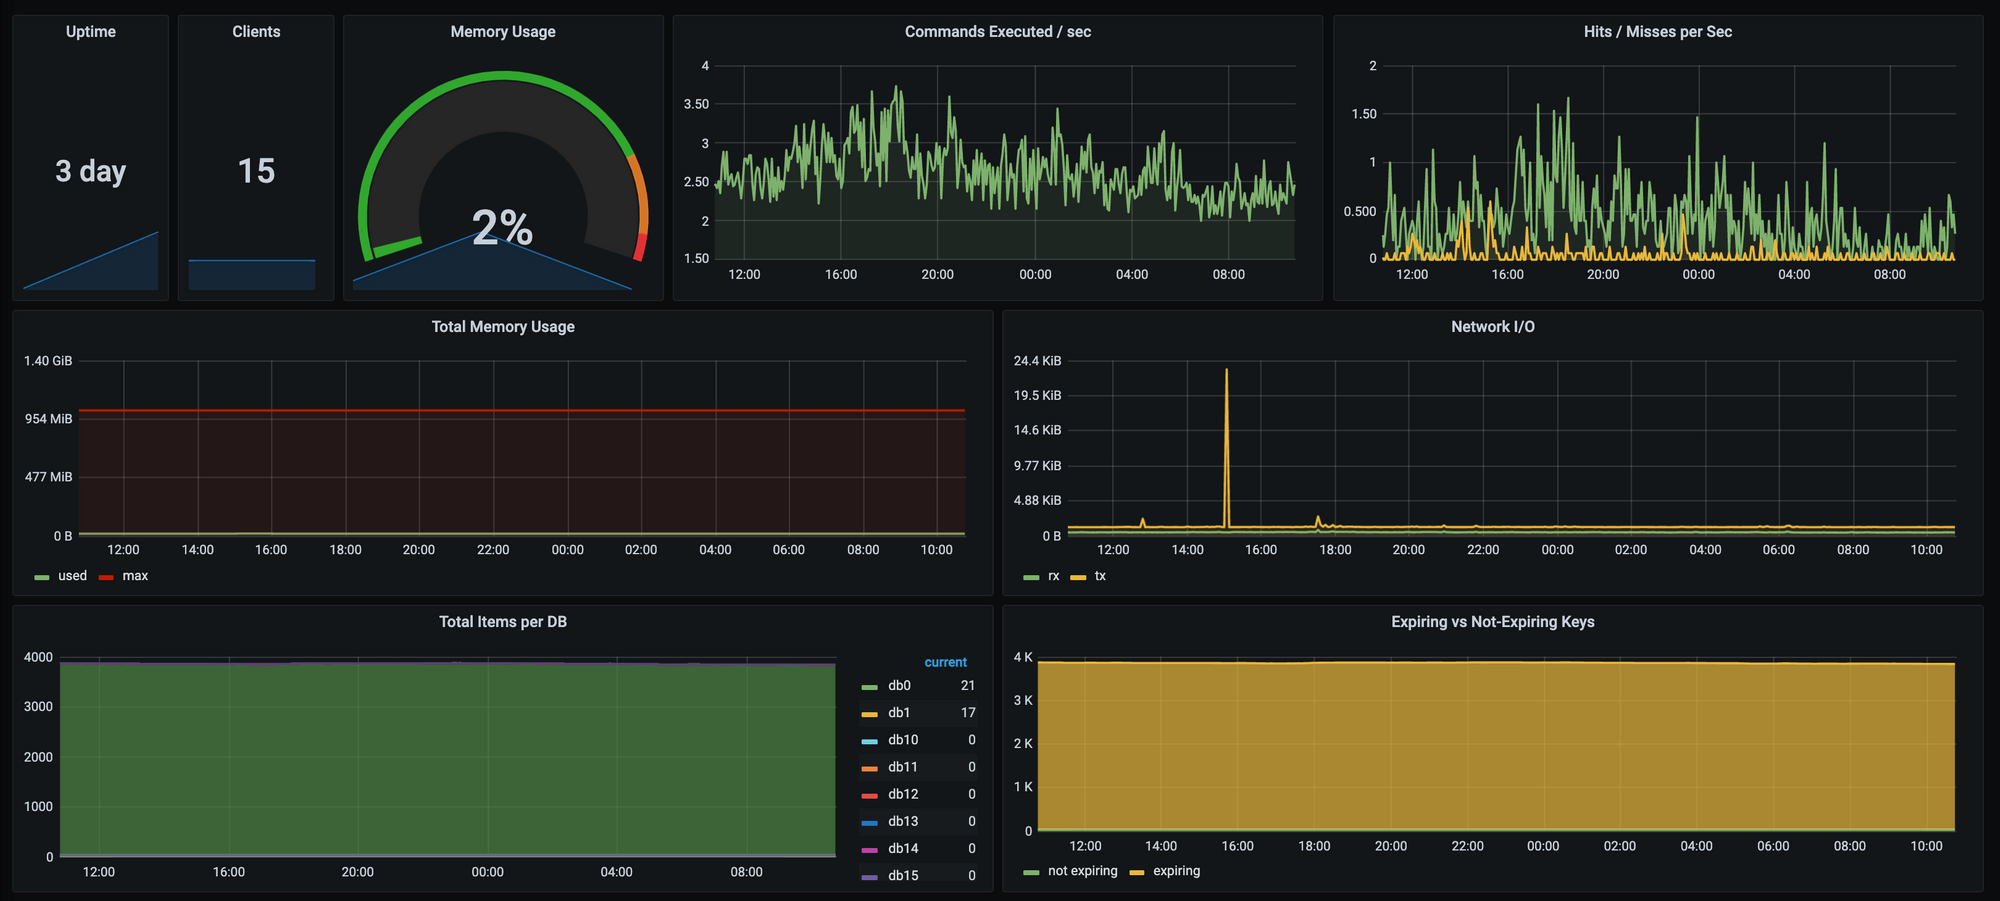
Combined, these exporters give us a great insight into how our core services such as PostgreSQL and Redis are performing, and allow us to pick up any performance snags long before they cause any major troubles.
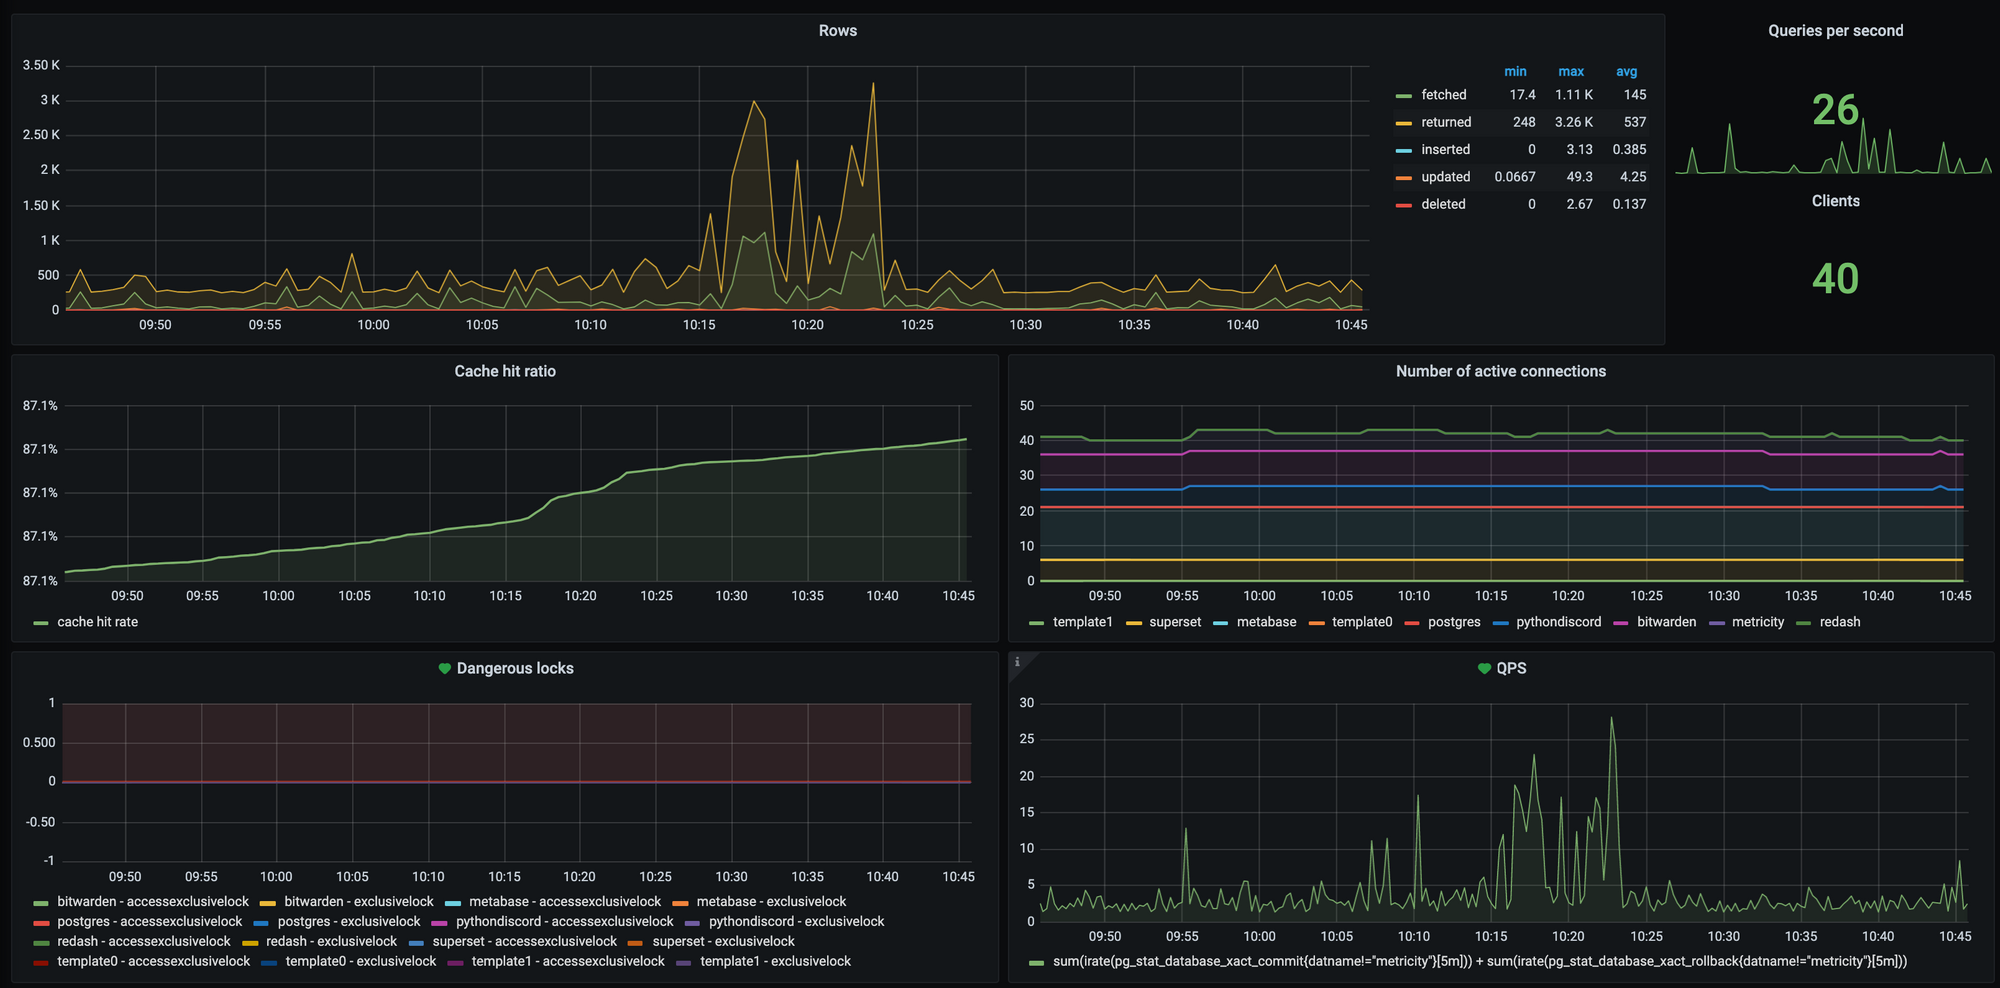
PostgreSQL

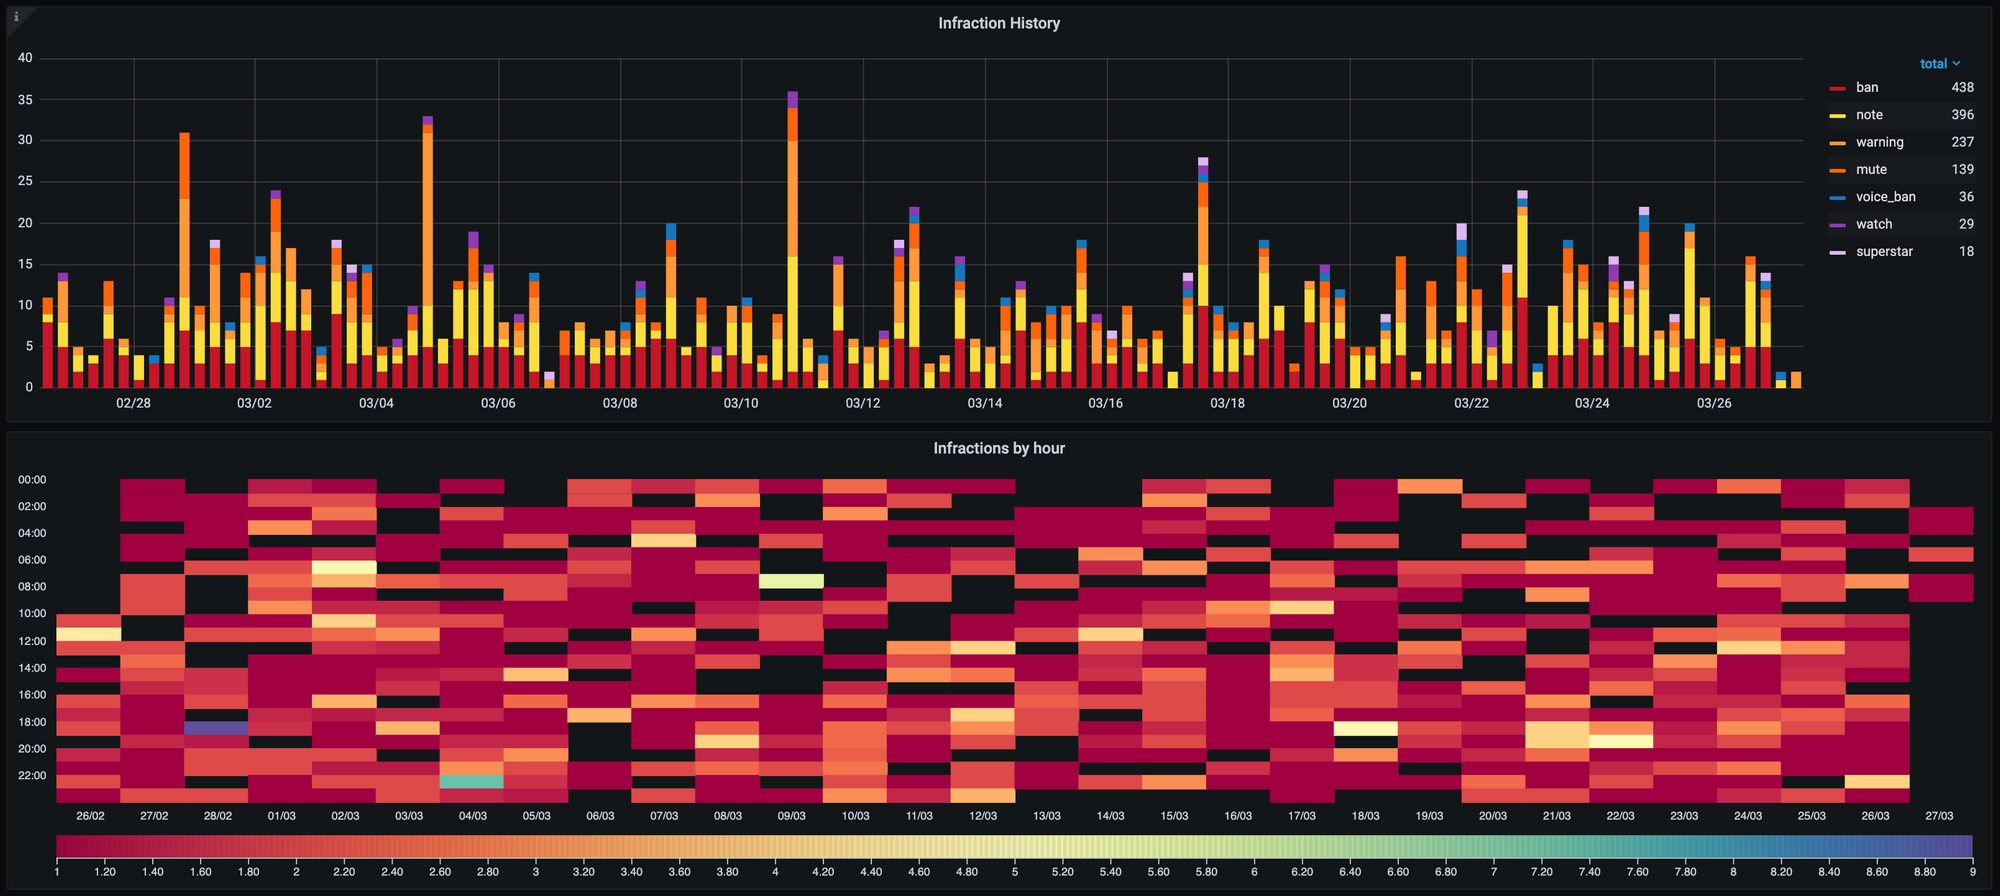
Of course, generating graphs of our non-statistics data is also incredibly useful. We give Grafana read-access to certain tables in our primary PostgreSQL instance so we can look at graphs of things like infraction distribution.
Wrapping it up
With all the above systems we've had great success increasing the observability of our services, with Discord statistics proving useful to make moderation decisions and system statistics helping to diagnose strange outages.
The infrastructure we have selected works well for us, but there are definitely improvements to it. If you have questions or suggestions we'd love to hear them, feel free to ping joe#6000 on Discord with any questions or suggestions!